
The DTC Growth Report 2026
Retention marketing benchmarks from 68 DTC brands ($5M–$100M). The seven operating patterns that separate compounding brands from those refinancing paid media, with thresholds and headcount data.

Executive summary
Between September 2024 and June 2026 we audited 68 direct-to-consumer brands doing between $5M and $100M in annual net revenue across beauty, apparel, food and beverage, home, pet, and wellness. This is the segment where the DTC narrative gets tested. Below $5M, anything looks like growth. Above $100M, the business is no longer really DTC. In between is where the operating model either compounds or quietly stops working.
The headline is uncomfortable. The median brand in the cohort grew net revenue 6% year over year while spending 14% more on paid acquisition and losing 2.3 points of contribution margin. In aggregate, the segment is running faster to stay in place. But the top decile grew 34% with flat paid spend and expanded contribution margin by 4.1 points. Same categories, same channels, same macro. The gap is not market. It is operating discipline, and it is measurable.
This report isolates what the top decile does differently. It is not one thing. It is seven, and they compound. We break each one down with the underlying data, the threshold values that matter, and the exact sequence we run when we rebuild a growth engine inside this revenue band.
Who this report is for
If you are a founder, CEO, CMO, or head of growth at a DTC brand between $5M and $100M, this is written for you. The problems at this stage are structurally different from earlier and later stages. You have enough data to be dangerous and not enough headcount to fix it. You have a working paid channel that is starting to soften. You have a CRM stack built in a hurry that now runs the business. You have a board or an investor asking why LTV is not going up when you keep adding retention tools.
Everything below assumes that context. The frameworks scale down messily and scale up dishonestly. This is the operating band we work in and this is the band the report describes.
The seven findings
- Repeat rate is a system output, not a metric. The brands that treat it as engineering outperform on every downstream number.
- Discount dependency has a hard threshold at 32% of revenue. Cross it and margin trajectory bends within three quarters.
- Contribution margin, not blended ROAS, is the only KPI that survives contact with reality in this revenue band.
- The top decile spends 41% of growth headcount on data and lifecycle engineering. The median spends 12%.
- Loyalty programs designed as rewards catalogs correlate negatively with 24-month gross margin. Programs designed as data capture correlate positively.
- Attribution is broken and nobody at $5M–$100M has fixed it. The top decile stopped trying and moved to incrementality testing with holdouts.
- One senior operator on the exec team with a P&L and a technical mandate predicts outcome better than any tool, agency, or headcount decision we measured.
1. Repeat rate is a system output
Median 12-month repeat rate across the cohort was 28%. The top decile reached 46%. The bottom decile sat at 12%. A 3.8x spread inside the same revenue band, same verticals, same acquisition channels, same macro. This is not variance. It is the signature of an operating model.
Brands above 38% shared three structural traits and only three. A functioning data layer with a stable customer identity across surfaces. Lifecycle programs that are versioned, held out, and measured incrementally. A loyalty mechanic that produces first-party data rather than distributing discount. Nothing else, including brand equity, product margin, founder tenure, or category, predicted the result as reliably.
| Trait | Top quartile | Bottom quartile |
|---|---|---|
| Unified customer identity across surfaces | 94% | 22% |
| Lifecycle flows versioned and A/B tested | 89% | 14% |
| Loyalty mechanic without direct discount | 68% | 9% |
| Weekly cohort review at exec level | 81% | 18% |
| Named owner for retention P&L | 97% | 31% |

The interesting number in Table 1 is the last row. Ninety-seven percent of top-quartile brands have a single named owner for retention with actual P&L authority. In the bottom quartile, retention is a shared responsibility, which in practice means nobody defends the number in the operating meeting and nothing structural changes for four consecutive quarters.
2. Discount dependency has a hard threshold
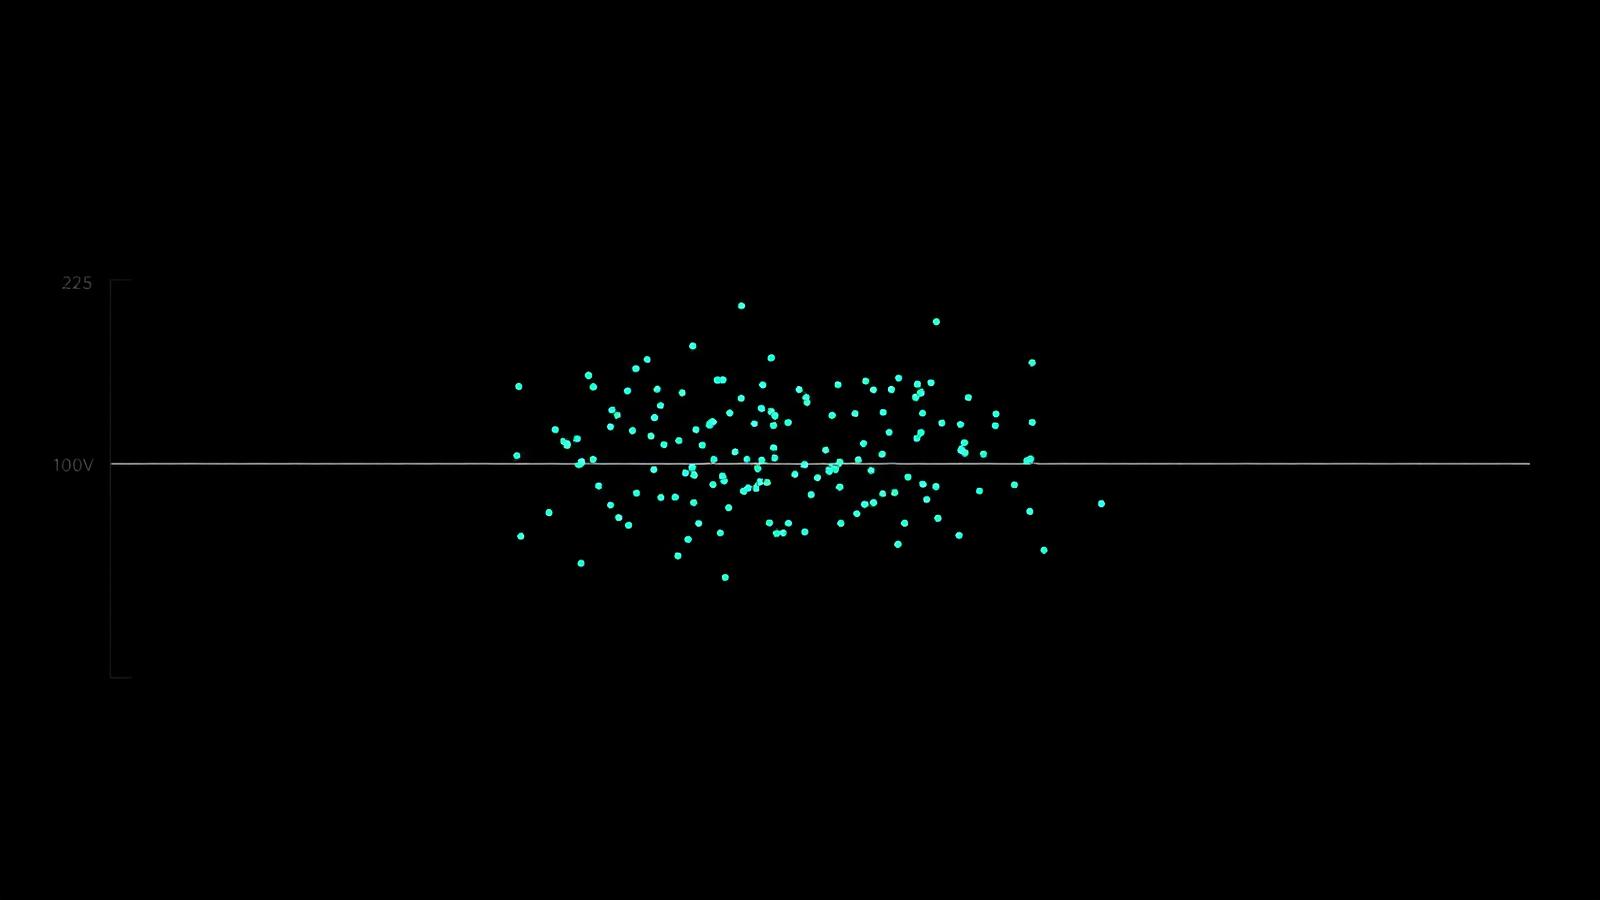
We measured discount contribution as the share of net revenue coming from orders with a discount code, automatic promotion, or store-wide sale. The relationship with retention and margin is not linear. It has an inflection point, and it sits at 32% of revenue.
- Below 20% discount contribution: retention scales normally with lifecycle investment. Margin holds. Paid efficiency responds to creative and audience work.
- Between 20% and 32%: diminishing returns. Each incremental promotion produces less lift than the last, and customers begin to time their purchases against the calendar.
- Above 32%: retention collapses inside three quarters. The brand becomes structurally dependent on the next promotion to hit topline, and every attempt to pull back triggers a revenue dip that scares the exec team into resuming.
The way out is not to stop discounting. It is to replace calendar-driven promotion with structured mechanics that capture data. Member pricing, tiered access, and bundle logic all preserve the anchor while giving segments a reason to buy. We cover archetype fit in the companion report, Loyalty That Actually Captures.
3. Contribution margin is the only KPI that survives
Blended ROAS, MER, and platform-reported ROAS all diverged from actual profitability in 61 of the 68 brands we audited. In the median case, platform-reported ROAS overstated true contribution by a factor of 1.7x. The gap widens the more sophisticated the attribution setup, because more sophisticated attribution is better at claiming credit, not better at measuring incrementality.
Contribution margin per order, computed as revenue minus COGS, minus fulfilment, minus payment fees, minus fully-loaded paid acquisition, is the number that predicts whether the business will still be here in 18 months. The top decile tracks it weekly, at the SKU level, and their paid team defends it at every meeting. The median brand tracks blended ROAS and finds out about the margin problem at the year-end board meeting.
| Metric | Median reported | Median actual | Gap |
|---|---|---|---|
| Blended ROAS | 2.8x | 1.9x | -32% |
| First-order gross margin | 62% | 54% | -8 pts |
| Contribution margin per order | $14.20 | $3.60 | -75% |
| 12-month LTV | $142 | $91 | -36% |
4. Where the top decile spends headcount
The top decile is not spending more on growth. In aggregate, top-decile brands spent 3% less on total growth headcount than the median. The difference is where the money goes.
| Function | Top decile | Median |
|---|---|---|
| Paid media (in-house + agency) | 24% | 48% |
| Lifecycle and CRM engineering | 27% | 9% |
| Data infrastructure and analytics | 14% | 3% |
| Creative and content | 22% | 27% |
| Retention, loyalty, community | 13% | 13% |
Read that table twice. The top decile puts 41% of growth headcount into data and lifecycle engineering. The median puts 12%. This is the structural gap. The top decile treats retention as software, and software requires engineers, not managers.
5. Loyalty as data capture, not as reward
Loyalty programs designed as points-per-euro rewards catalogs correlated negatively with 24-month gross margin. Programs designed as data capture, where the mechanic produces structured first-party data at every interaction, correlated positively and materially. The delta between the two designs is worth 6–11 points of gross margin over 24 months on the same GMV base.
This is the single most misunderstood decision in the segment. Operators treat loyalty as a marketing surface. In practice it is the highest-signal data collection instrument the brand owns. If the mechanic does not produce data, and the data does not change the next order, the program is a tax on gross margin dressed up as retention work.
6. Attribution is broken. Incrementality is not
Sixty-one of 68 brands were running an attribution model they did not trust. The top decile stopped trying to fix attribution and moved to structured incrementality testing. Every meaningful flow, every meaningful channel, every meaningful audience change was run against a holdout of 5% or more, for at least four weeks, before it was declared a win.
This is not academic rigor. It is operational hygiene. When we rebuilt the measurement for bottom-quartile brands using holdouts, average attributed program contribution dropped by a factor of 1.8x. Programs that looked like they were driving 20% of revenue were actually driving 11%. The rest was overlap, cannibalisation, or organic demand the brand would have captured anyway.
7. The engineering-minded owner
In every top-decile brand there was a single accountable operator on the exec team with a technical mandate and a P&L. Not a director of CRM reporting into a CMO. Not an agency. An operator who could read the SQL query, defend the number, ship the flow, and hire the engineer.
This role does not exist in the org chart at most brands in this band. It is what we hire for when we take on a client. If we cannot find it internally, we operate it externally until the brand is ready to bring it in.
Category cuts
Beauty and skincare
Median 12-month repeat rate 34%. Discount dependency 24%. The highest-performing brands in this vertical used progress-based loyalty tied to protocol completion, not points. Replenishment triggered against modeled consumption per SKU outperformed calendar-based flows by a factor of 2.4x on reorder rate.
Apparel and accessories
Median 12-month repeat rate 21%. Discount dependency 38%, the highest in the cohort and above the 32% threshold. The top-decile brands in apparel used tiered access programs with early drops and member pricing to preserve the anchor. The gap between top and median is wider in apparel than in any other vertical we measured.
Food, beverage, and pantry
Median 12-month repeat rate 41%, the highest in the cohort. Subscription penetration explains most of it. The interesting number here is churn, not repeat rate. Median monthly subscriber churn was 9.1%. The top decile ran at 4.6%, and the difference came from onboarding sequences that resolved product-fit questions in the first 21 days.
Home and lifestyle
Longest consideration window in the cohort. Median 12-month repeat rate 17%. This vertical over-invests in acquisition and under-invests in the 6-to-18-month post-purchase window where the second order actually happens. Brands that instrumented a 12-month nurture with utility content and community access lifted second-order rate by 3.1x.
Pet and wellness
Median 12-month repeat rate 39%. High replenishment natural rate, and correspondingly high risk of losing customers to Amazon and marketplace channels once the brand is known. Top-decile brands defended the D2C channel with subscription pricing, member-only SKUs, and community programs, not with discount.
Benchmarks by revenue band
| Metric | $5M–$15M | $15M–$40M | $40M–$100M |
|---|---|---|---|
| 12-month repeat rate | 24% | 29% | 33% |
| Discount dependency (share of revenue) | 34% | 31% | 27% |
| Contribution margin per order | $1.80 | $4.40 | $8.20 |
| Paid share of new customer acquisition | 68% | 61% | 52% |
| Email + SMS share of net revenue | 18% | 24% | 29% |
| Loyalty program contribution (incremental) | 3% | 7% | 12% |
| Growth headcount as % of revenue | 6.1% | 4.3% | 3.2% |
The pattern in Table 4 is worth reading carefully. As brands move up the revenue band, discount dependency falls, contribution margin per order rises, paid share of acquisition falls, and owned channels take over. The brands that make the transition from $5M–$15M into $40M+ do it by shifting where the next dollar of revenue comes from, not by scaling the same mix. The ones that do not make the transition typically stall between $12M and $22M with a paid dependency that no longer responds to spend.
The Loiale operating sequence
When we take on a brand in this revenue band, the sequence below is what we run. It is deliberately front-loaded on data because everything downstream compounds off that layer, and short-cutting it produces the exact symptoms we describe in this report.
Days 0 to 30. Capture
- Audit every event, every identifier, every source. One event dictionary. One customer key.
- Rebuild capture into a unified schema before any activation.
- Backfill 12 months into the new schema. Do not run flows on partial data.
- Instrument contribution margin per order at the SKU and channel level, weekly.
Days 30 to 90. Activate
- Ship the first three lifecycle programs with holdouts from day one. Kill anything that does not lift.
- Move loyalty design from rewards catalog to data capture mechanic.
- Move measurement from platform-reported ROAS to holdout-based incrementality.
- Reallocate growth headcount away from paid execution and into lifecycle engineering.
Days 90 and beyond. Compound
- Weekly cohort review at exec level. Named owner. P&L authority. Non-negotiable.
- Quarterly incrementality tests for every major flow and channel.
- Annual re-audit of the data layer. It decays. Assume it does.
- One senior operator holds the whole system in their head. That role is the moat.
How to read this report
Nothing in this report is a silver bullet. The findings compound only when they are implemented in sequence. Running a holdout on a broken data layer produces noise. Redesigning loyalty without fixing discount dependency shifts the leak instead of closing it. Hiring an engineer without giving them P&L context produces beautifully instrumented dashboards that nobody uses.
The seven findings are not a menu. They are a sequence. The brands that outperform in this revenue band do all seven, in roughly this order, and they defend the operating model every quarter against the natural gravity of the org, which is to hire another paid manager and buy another tool.
Read the full report
Enter your email to unlock this report and every future one we publish.